Reporting and BI
Understanding the base through Data Visualization and Reporting.
Data Square excels at transforming raw data into insightful reports, powerful visuals, and compelling stories. Fueled by a customized metrics and measurement strategy, our CRM platform is designed to deliver real-time reports and data visualizations from a fully integrated data hub.
Metrics Strategy
Business Intelligence
Business Goals
Metrics and Measures
KPI’s and Segments
Dashboard and Report Design
Reporting Technology
Reporting Data mart
Reporting Infrastructure
CRM Database Integration
Reporting Automation
Ad-hoc Reporting Functionality
Data Visualization
Dashboards
Standard Reports
Interactive Reports
Report Library
Profiles
Reporting Services
Reporting Data mart
Infrastructure Build
Report Library Build
Custom Reports
Reporting Insights
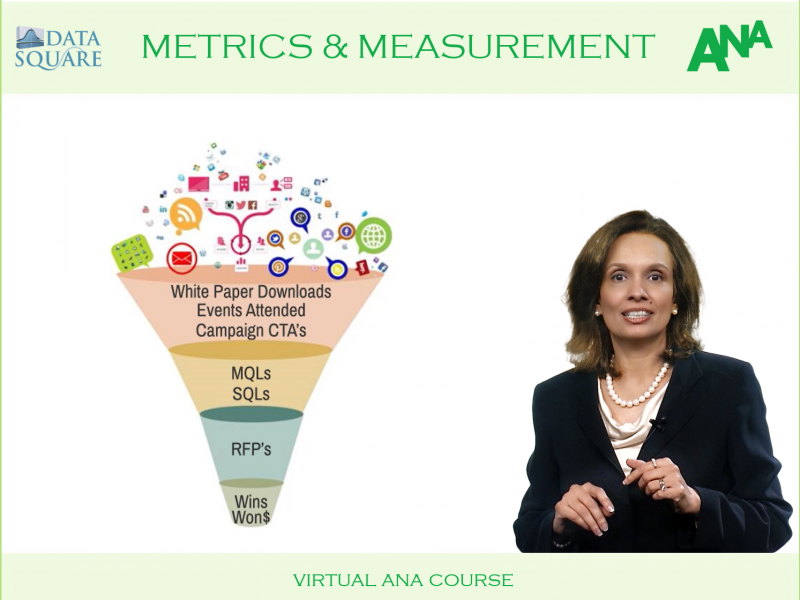
Metrics and Measurement Strategy
Tracking the wrong metrics could be worse than not tracking at all.
At Data Square, we begin by reviewing your overarching business objectives and ensuring that clear, quantitative and time-based goals are defined. We then conduct a formal selection of SMART metrics — specific, measurable, attainable, relevant, and time-bound. Drilling down, we identify key performance indicators (KPI’s) that include leading, lagging and other data transformations for tracking and reporting. The final step involves a conversion into reports, dashboards, or other data visualization media.
Metrics Strategy Course
Reporting Tools and Technology
Setting up for success with the right marketing technology stack.
Your disparate data sources and CRM databases are integrated into a consistent report-ready format. Custom transformations and data marts are designed to generate ease of use, insights, and storytelling. CRM Square’s reporting platform or third-party tools are used to deliver scheduled Report Libraries and Dashboards via email, phone, ftp, or web. Users are enabled with transformed and ready-to-use aggregated fields to interactively build ad-hoc reports, charts, and graphs to answer interactive questions in real-time.
CRM Platform
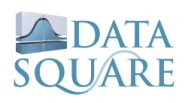
Dashboards and Data Visualization
Transforming static reports into powerful visuals and stories.
At Data Square, we design world-class dashboards and data visualization tools to track, analyze, and display KPIs, metrics, and critical data points. Ultimately, the metrics that will help you succeed. These include standard reports, report libraries, interactive reports and profiles.
Dashboard Course
Custom Reporting Services
From data to reports. From reports to insights.
Designed to enhance your marketing and sales performance, the experts at Data Square will help you build a reporting infrastructure that includes reporting data marts specifically optimized for specific business units and geographies. Fueled by the fusion of our deep analytic experience and marketing intelligence, we design standard report libraries that are meant to answer the majority of your questions. The remaining issues are addressed via interactive custom reports and data visualizations. Last but not the least, we not only build reports and visualizations but extract key insights and underlying patterns to tell a story and improve business outcomes.
See More
Data Square provides industry leadership in developing metrics and measurement strategies, CRM reporting, dashboards and data visualizations.
Dashboard Course
Data Visualization best practices for tracking, benchmarking, and actionable insights.
Ready to transform your data into insights?
Find out how Data Square improves outcomes with its standard and ad-hoc reporting infrastructure.
SCHEDULE DEMO