4 Proven Ways to Lift Marketing Campaign ROI
By Devyani Sadh, Ph.D. Published in Target Market Magazine.
Although there are many drivers of overall campaign success, four factors with significant untapped ROI potential are outlined based on strategic CRM practice assessments conducted by Data Square and informal polls administered during a series of Direct Marketing Association CRM and Database Marketing seminars I taught. The key factors include: de-duplication, predictive analytics, enterprise campaign testing strategy and inclusion of referral metrics.
Deduplication
In a number of strategic CRM practice assessments, the presence of duplicate customer records was found to be a key issue plaguing both mid-market and large-sized companies. Duplicates within marketing databases ranged from 5 percent to 15 percent, often stemming from an inability to standardize certain types of addresses. Multiple mailings to the same customer, communications with inappropriate messages (e.g., cross-sell, reactivation) and inability to identify high-value customers because their purchase history is spread across multiple records are just a few of the ramifications. Consolidating duplicates will typically pay for itself—not just for heavy direct mail organizations, but also for those that use e-mail as their primary communication channel.
Predictive Analytics
A second tactic that can have considerable impact on campaign effectiveness is the use of predictive models. However, this is typically going to hold true for expensive or high-volume campaigns.
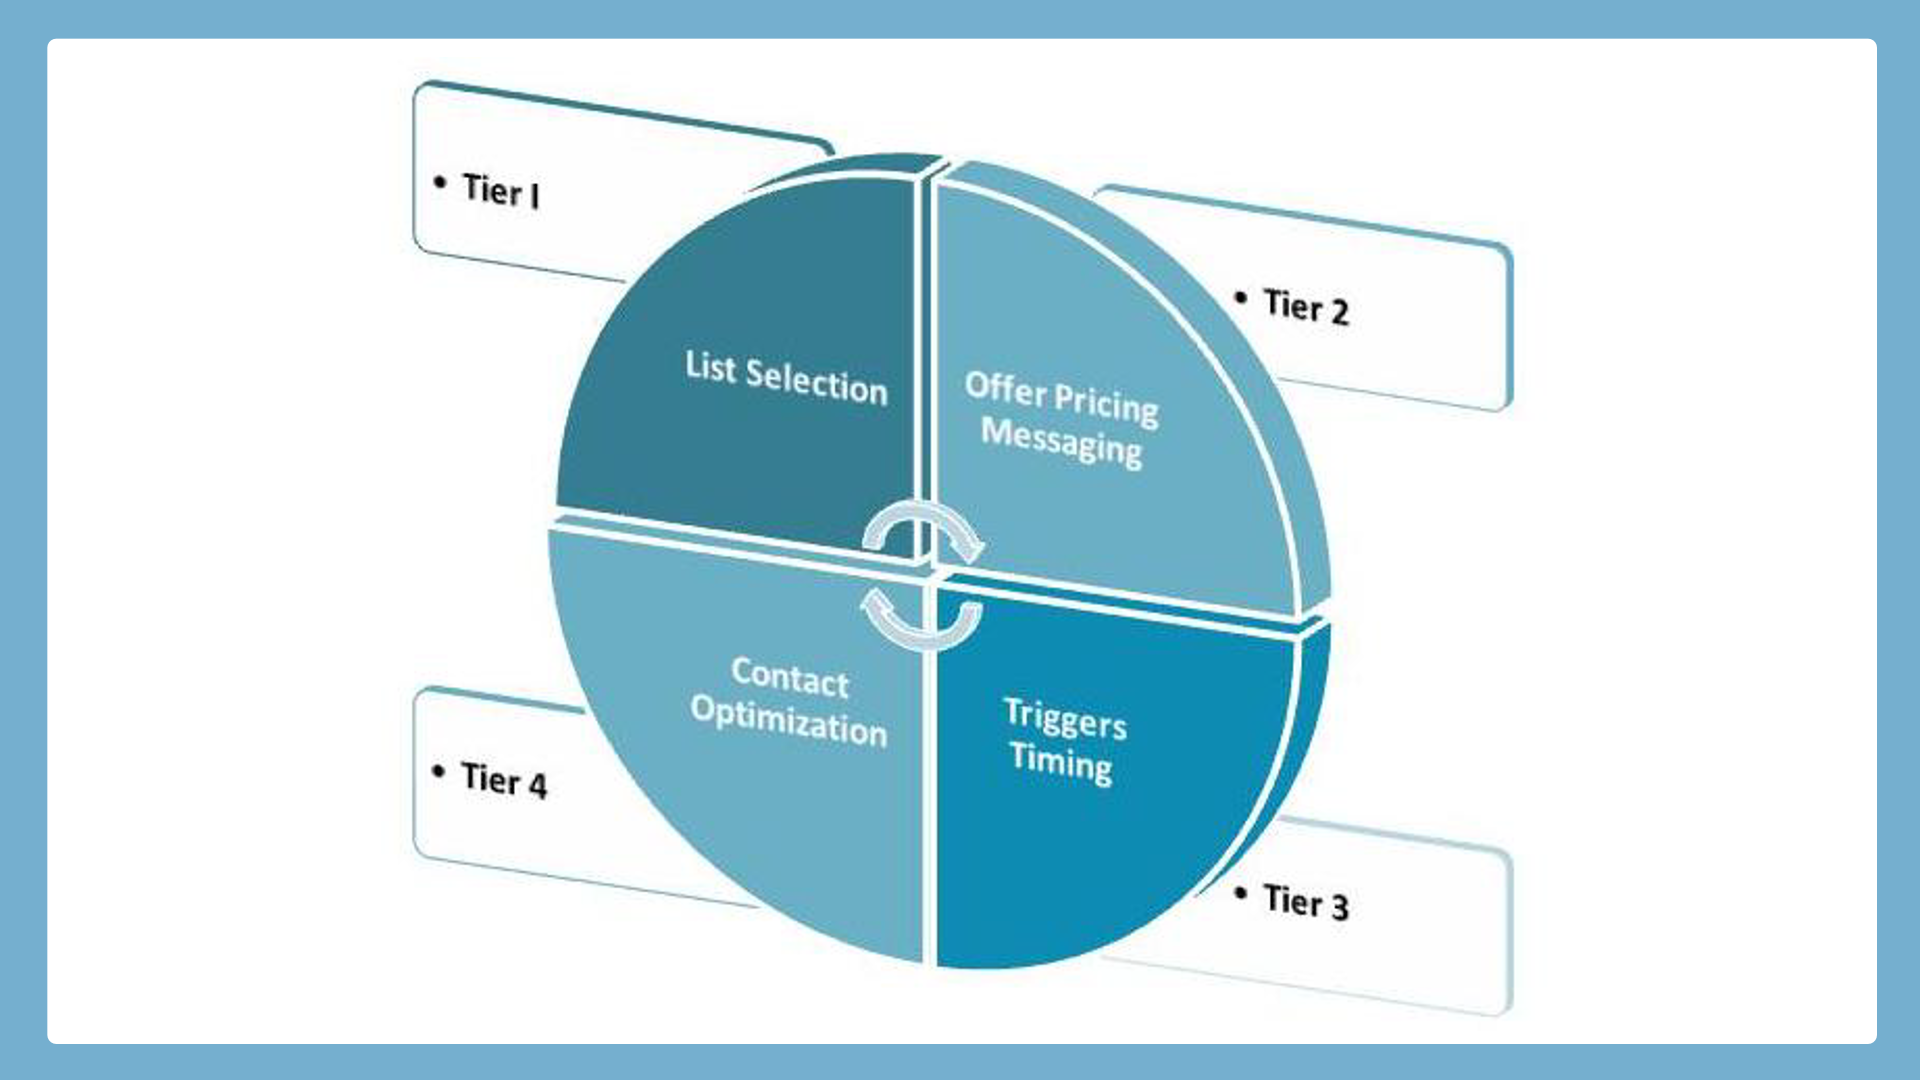
Tier 1 Analytics
These represent list selection methods and are by far the most frequently used category. In Tier 1 Data Square analytic implementations, we have routinely seen returns of 300 percent to 1,500 percent within B-to-B and B-to-C sectors across a range of verticals including retail, consumer packaged goods and technology. In Tier 1 Data Square analytic implementations, we have routinely seen returns of 300 percent to 1,500 percent within B-to-B and B-to-C sectors across a range of verticals including retail, consumer packaged goods and technology. Tier 1 predictive models that were being used most frequently and/or associated with the highest ROI include: a) response models that identify customers who are most likely to respond to a marketing communication; b) best customer models that rank customers on their predicted profit in the next year/quarter; c) cross-sell models that rank customers on their likelihood to purchase specific products; and d) acquisition models used to select prospects from a larger base.
Tier 2 Analytics
These include methods designed to optimize offer, pricing and messaging at the customer level. Research shows that a significant percent of coupons are not redeemed and cost organizations millions of dollars annually. Analytic opportunity areas include: a) offer optimization analytics that consider interactions between customer value segments and offers; b) messaging analytics that consider interactions between customer need and preference segments with messaging strategies; and c) pricing analytics that consider a combination of needs, preferences and customer value.
Tier 3 Analytics
These represent ways to optimize campaign timing and relevancy and include lifecycle, life stage, purchase cycle and behavioral triggers. Examples include the identification of leading indicators for positive behaviors (such as cross-sell, upsell) and negative behaviors (such as bad debt, churn, spend reduction, fraud). Although Tier 3 analytics are least common, several organizations have reported successes based on these tactics. For example, Staples and Fidelity report doubling their performance via a timing focus. Schwab and Wells Fargo show significant returns by focusing on relevancy driven by trigger-based marketing and lifecycle messaging.
Tier 4 Analytics
These refer to contact and channel/marketing mix optimization. Analytics in this category are the most complex and designed to optimize the frequency, timing and sequence of contacts across channels for each customer and campaign. For one large B-to-B marketer, contact cadence analysis helped identify the optimal number of marketing communications, resulting in the redirection of millions of dollars previously spent on wasteful touches.
For direct mail campaigns, Tier 1 is the first place to start. One should commence with Tier 2 offer optimization at the customer-level for email and mobile marketing campaigns. For multichannel campaigns, Tier 4 analytics become extremely relevant—as they can help identify the optimal mix of channels, touch frequency and sequence.
Enterprise Campaign Testing Strategy
A third method of enhancing campaign effectiveness is the development of an enterprise testing strategy. This entails the creation of standards for key areas, such as: a) campaign dimensions and taxonomies; b) cross-channel evaluation metrics; and c) control groups.
Campaign Dimensions and Taxonomies
Identifying a consistent set of dimensions and values will help evaluate results by campaign category, compare new campaigns against category averages and enable the development of category-specific benchmarks for evaluating relative campaign success. It also helps set marketing investment levels based on prior performance. For example, the campaign objective dimension may be categorized into informational, promotional, transactional and loyalty campaigns. Campaign type could be classified as holiday, upsell, cross-sell, refer-a-friend, reactivate, etc. Offers may be grouped as percent vs. dollar off, limited time or quantity, free vs. discount on general, specific department or stock keeping unit. Frequently used test dimensions for e-mail campaigns include: customer segment, lifecycle, timing, frequency, headers (from name and subject line), call-to-action, wave, personalization (name, geography, interests, browsing, transactions), creative, copy, content, graphics, layout, format, landing pages and advertisements.
Consistent Cross-channel Metrics
Developing consistent and relevant metrics for each channel, as well as methods for aggregating and standardizing metrics across channels, is another important success factor. As an example, e-mail campaign evaluation should include individual metrics such as deliverability, bounces, unsubscribes, spam complaints, open rates, clicks, conversions, sales, net sales and satisfaction. In addition, it would be important to compute an aggregated campaign profit metric that balances net sales against the negative impact of spam complaints, unsubscribes and satisfaction ratings; as well as product margins, promotion and fulfillment costs. The fully loaded campaign profit metric could then be used to drive investment decisions; whereas, the individual metrics could be used in a diagnostic fashion to identify weak links, tweak micro-level campaign attributes and create differential strategies by segment. For example, a high percentage of opens but no clicks points to header issues; whereas, a prevalence of customers with clicks but no conversions may point to offer issues. Finally, a way to standardize metrics across channels is important, because it can help ascertain the relative value of each channel in driving returns, both individually and in combination. Multichannel campaigns will often demonstrate that the whole is greater than the sum of its parts.
Control Groups
Control group standards should range from minimum size requirements, statistically significant quantities based on expected response rates, differences and related factors, as well as weighting guidelines. Our assessments have shown that invalid control groups (for example, those that are not appropriately weighted by segments) appear to be a prevalent reason that marketers end up drawing inaccurate conclusions pertaining to campaign success and ROI.
Capturing Referral Value in Campaign Metrics
Many organizations continue to underestimate the value driven by their marketing campaigns, because they only measure the direct sales impact on promoted customers. The recommendation is to compute a fully loaded customer profit metric that includes not just the revenue directly generated by a customer, but the total profit realized from the customers’ direct and indirect referrals, networks and advocacy/influencer status. With the rise in social networking, word-of-mouth and viral components in both traditional and emerging channels, this is becoming an increasingly important dimension.